| Version 42 (modified by murphpo, 10 years ago) (diff) |
|---|
Investigating Physical Carrier Sensing in the DCF with Multiple Traffic Flows
The purpose of the 802.11 Distributed Coordination Function (DCF) is to allow multiple traffic flows to contend for a shared wireless medium. In this application note we investigate how the Mango 802.11 Reference Design behaves when subjected to multiple traffic flows. This note provides a case study on how the design's experiments framework can be used to control and analyze the performance of 802.11 Reference Design nodes.
Experimental Setup
The experiments described below used 3 Mango WARP v3 kits, each running the 802.11 Reference Design (version v0.91).
Each node's RF interface was connected to an antenna with a toroidal pattern with 5dBi gain in all horizontal directions (L-Com RE07U-SM).
The nodes were indoors in a small office environment with limited mobility.

|
| Experimental Setup |
Experiment Details
- Packet Length: 1400 byte payloads (1428 bytes OTA with MAC header and FCS)
- PHY Rate: 18 Mbps (QPSK, code rate 3/4)
- Tx Power: -5 dBm
- Trial Duration: 300 seconds
- 2.4GHz channel 1
- Physical Carrier Sensing Threshold: approximately -70 dBm when enabled
We use 4 traffic flows in our experiments:
- Flow 1: Backlogged traffic from AP to STA_1
- Flow 2: Backlogged traffic from AP to STA_2
- Flow 3: Backlogged traffic from STA_1 to AP
- Flow 4: Backlogged traffic from STA_2 to AP
The colors in the figure above are used throughout this app note to denote each flow.
Analysis #1: Aggregate Results
The simplest analysis uses the aggregate Tx/Rx statistics at each node. These statistics include the total number of packets and bytes transmitted and received for each flow, and the number of successful packets and bytes for each flow.
These statistics are sufficient to calculate total throughput, packet delivery ratio (PDR) and average number of re-transmissions per packet.
As illustrated below the aggregate statistics mask some interesting MAC behavior changes when carrier sensing is disabled.
| - | Flow 1 | Flow 2 | Flow 3 | Flow 4 |
|---|---|---|---|---|
| Tx Pkts | 1 | 2 | 3 | 4 |
| Rx Pkts | 1 | 2 | 3 | 4 |
Experiment 1: Physical Carrier Sensing Enabled
The first experiment enables physical carrier sensing at all 3 nodes. This experiment highlights the expected behavior of the DCF in an environment with heavy contention for the medium.
Experiment Details
- Packet Length: 1400 byte payloads (1428 bytes OTA with MAC header and FCS)
- PHY Rate: 18 Mbps (QPSK, code rate 3/4)
- Tx Power: -5 dBm
- Trial Duration: 300 seconds
- 2.4GHz channel 1
- Physical Carrier Sensing Threshold: 250/1023 (approximately -70 dBm)
Analysis
The same analysis is performed on the results of the two experiments below. The analysis results are shown in the plots for experiment.
Aggregate Results
Log-based Results
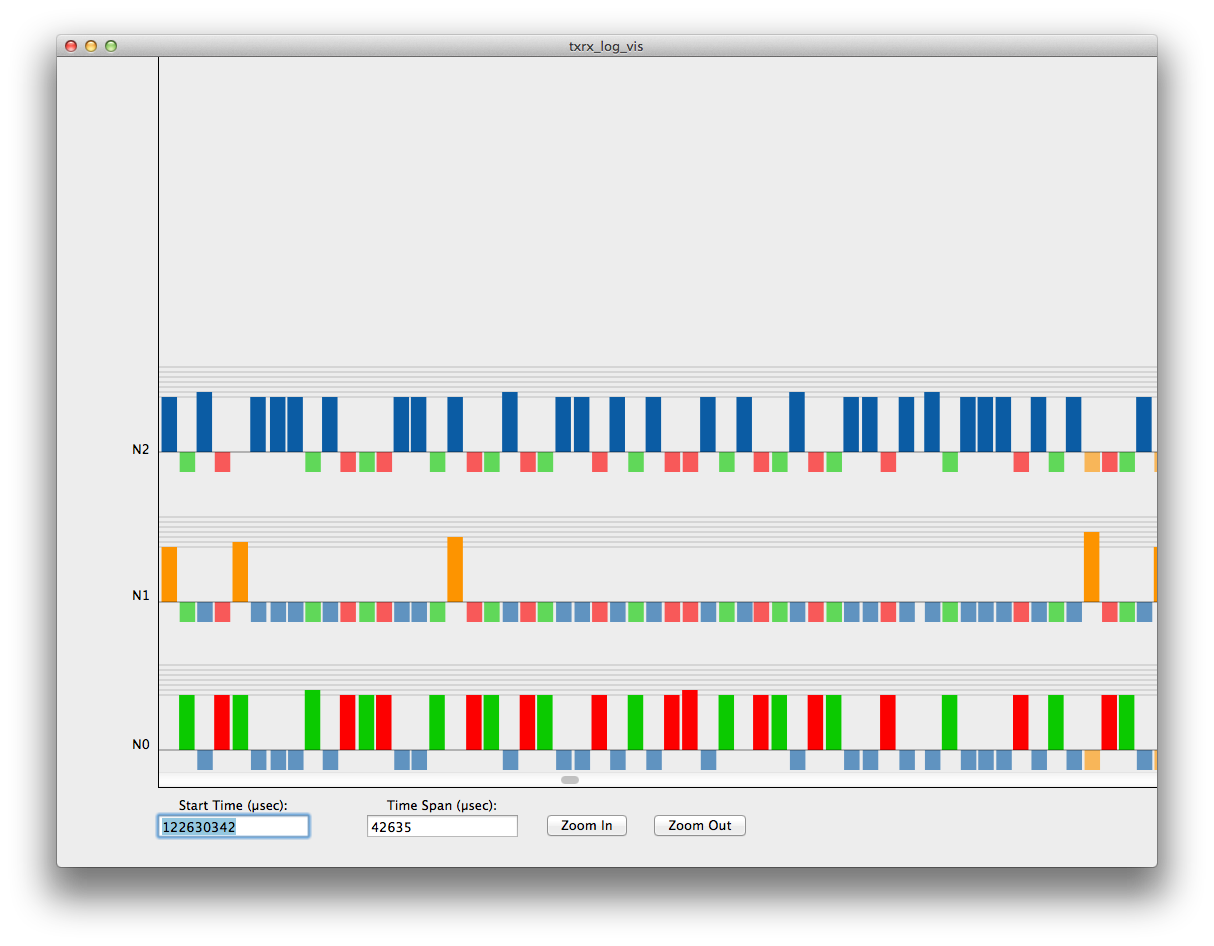
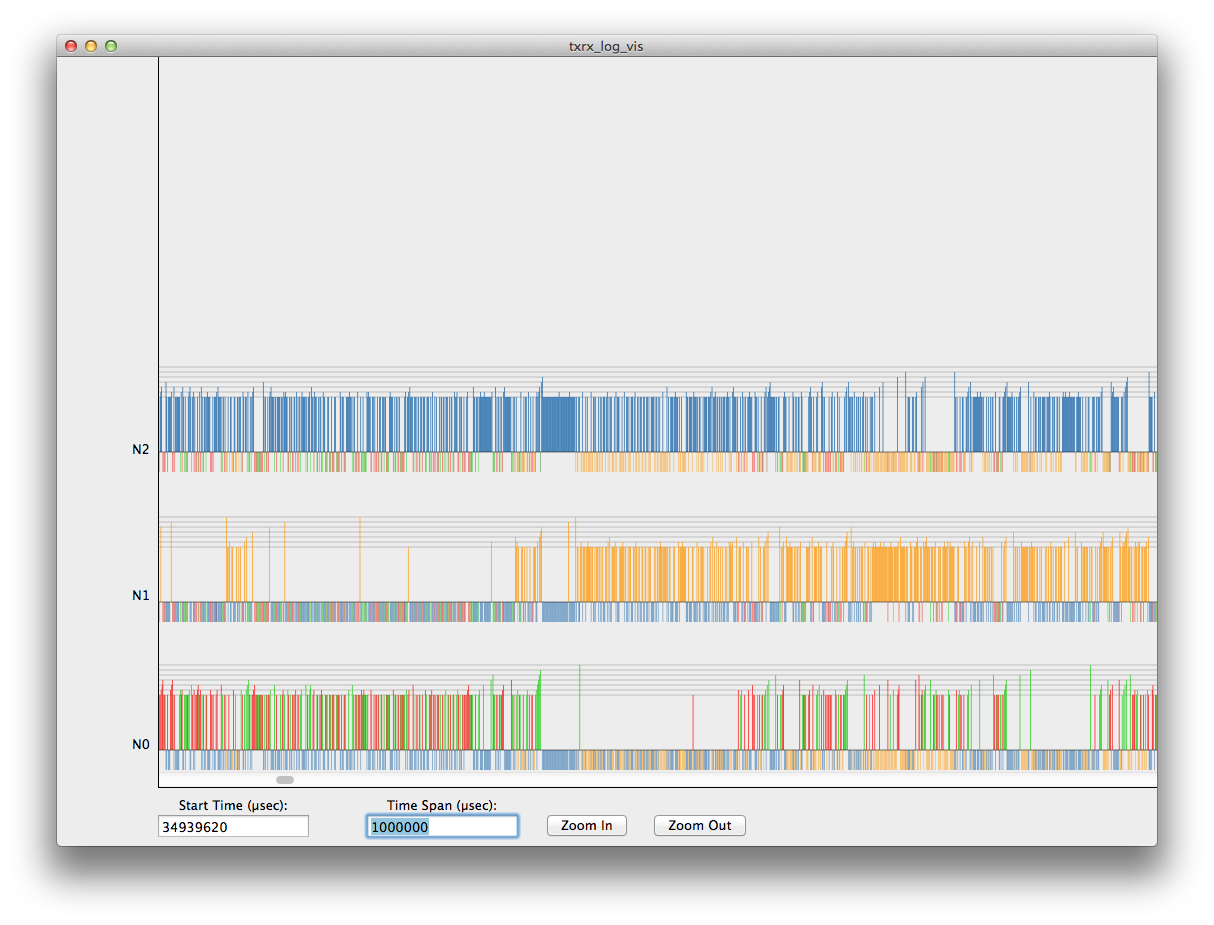
Each experiment ran for 300 seconds, during which all three nodes were writing logs to local memory for every Tx and Rx event. These logs were retrieved after the experiment for analysis.
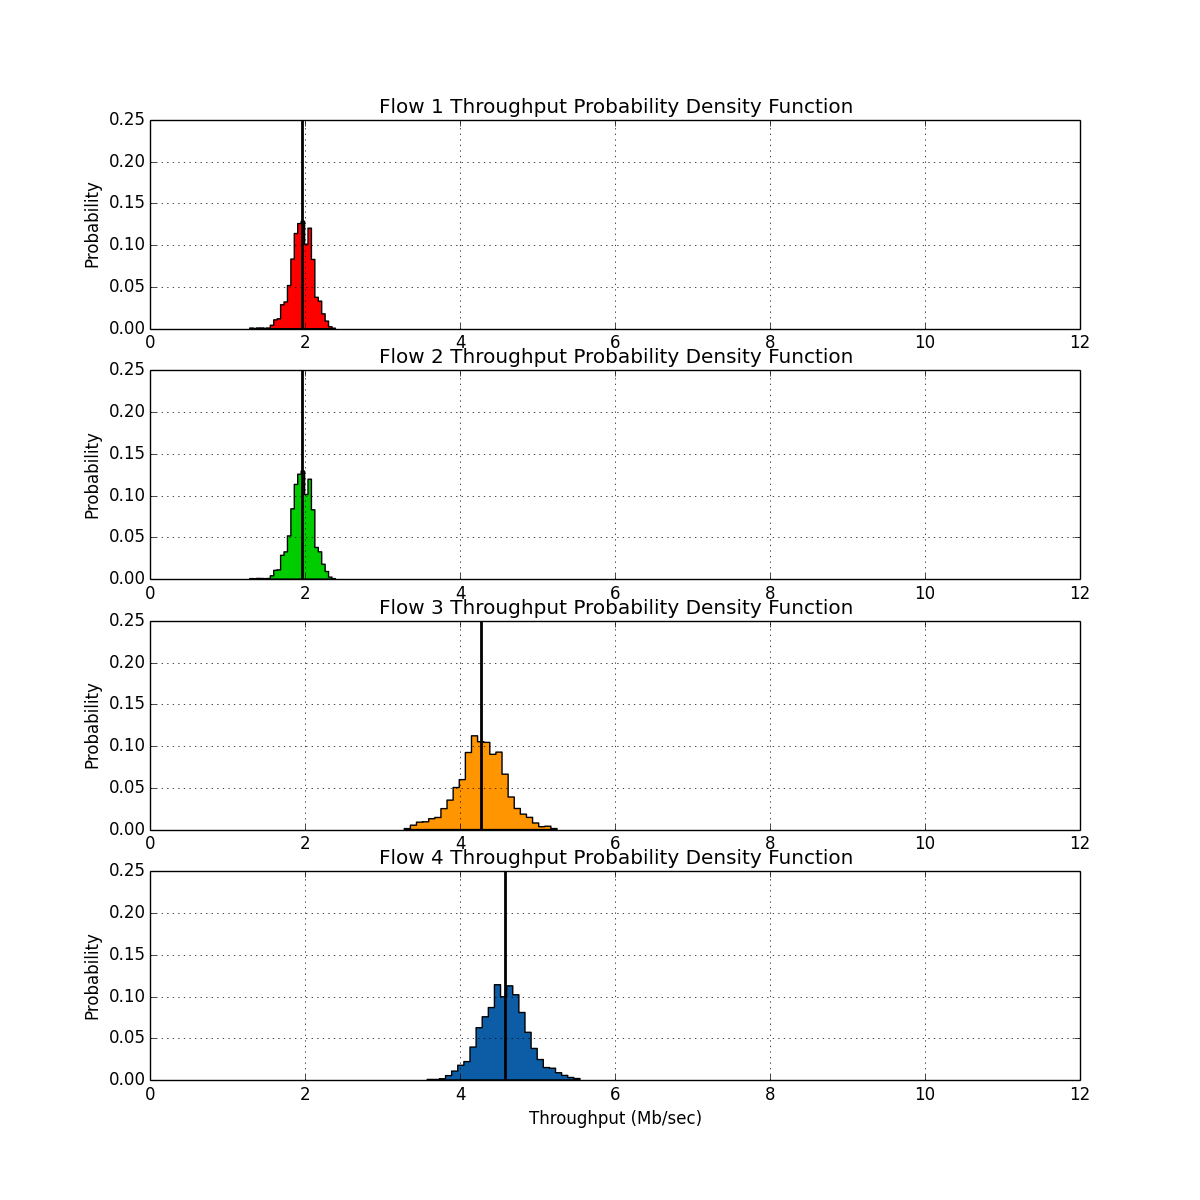
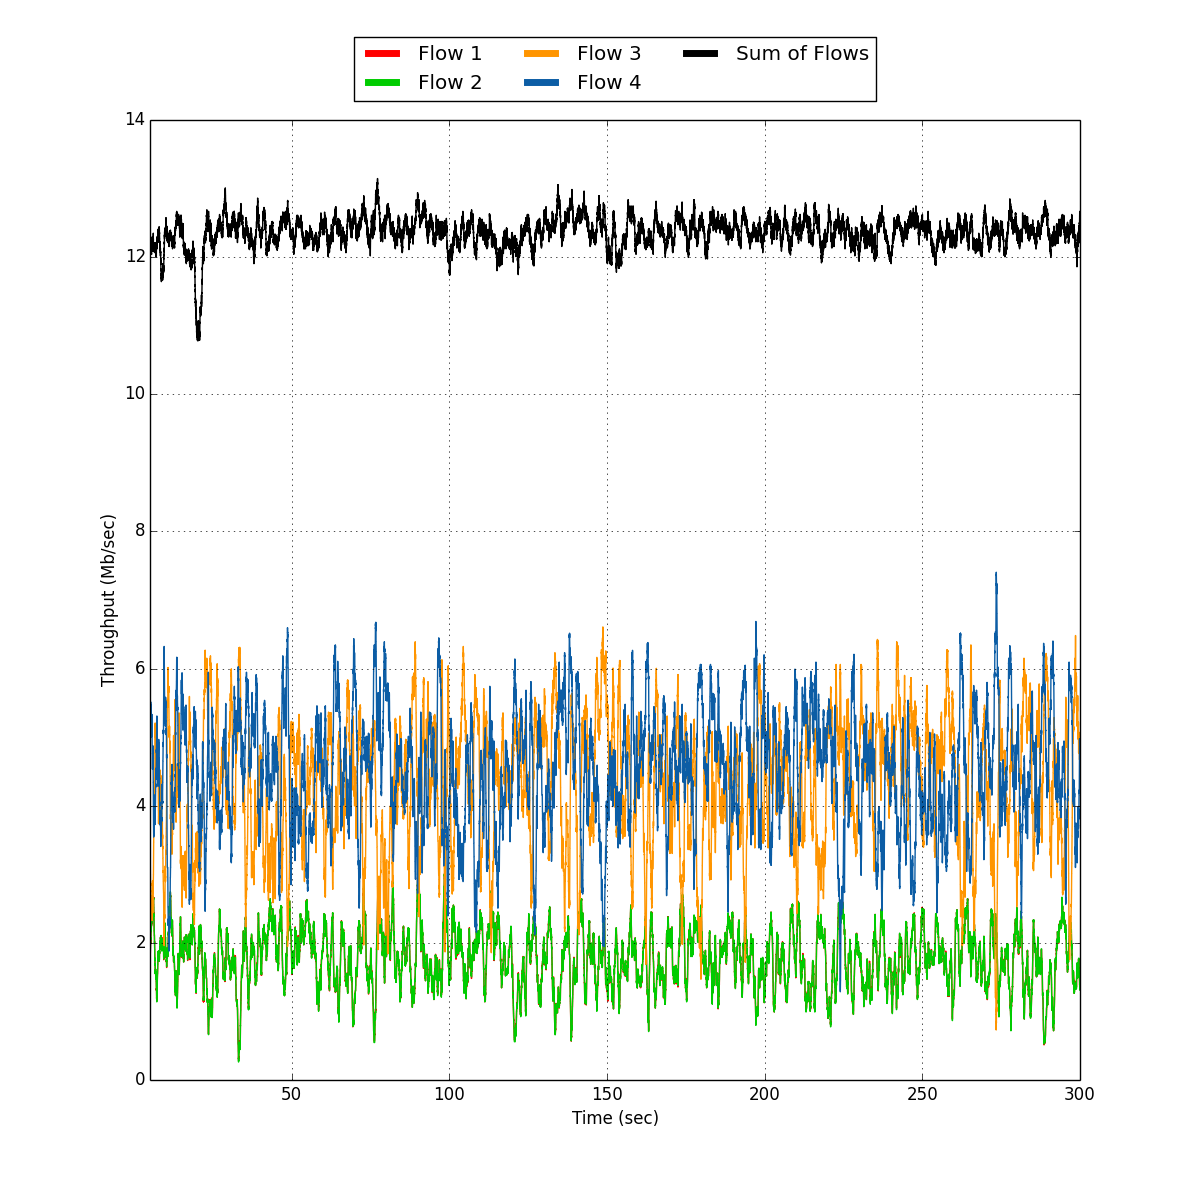
- Throughput vs. Time: computes the throughput of each flow over a 1 second rolling window. The aggregate throughput calculated above is the mean of the 1 second throughputs, but very interesting behaviors can be observed by calculating these throughputs on shorter time scales.
- Throughput Histogram: plots the probability density function of the time series of throughputs calculated for Throughput vs. Time.
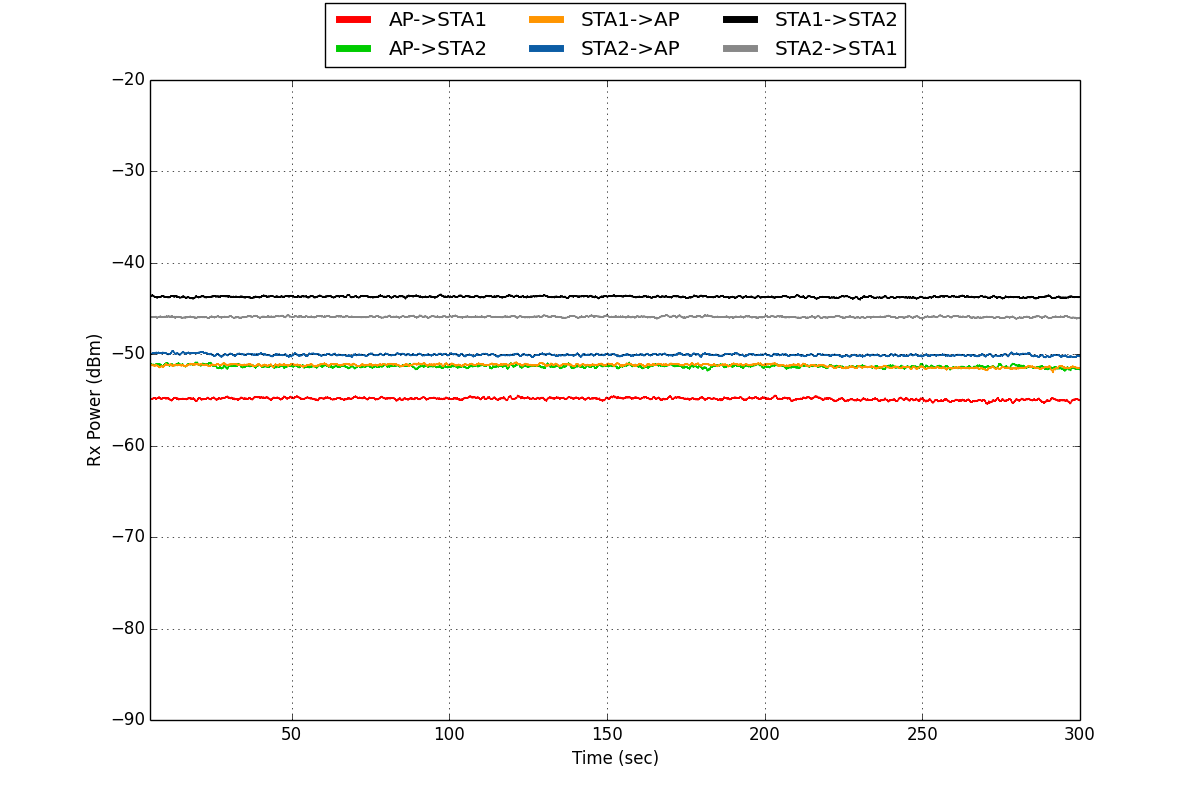
- Rx Power vs. Time: plots the power of every packet received for each flow
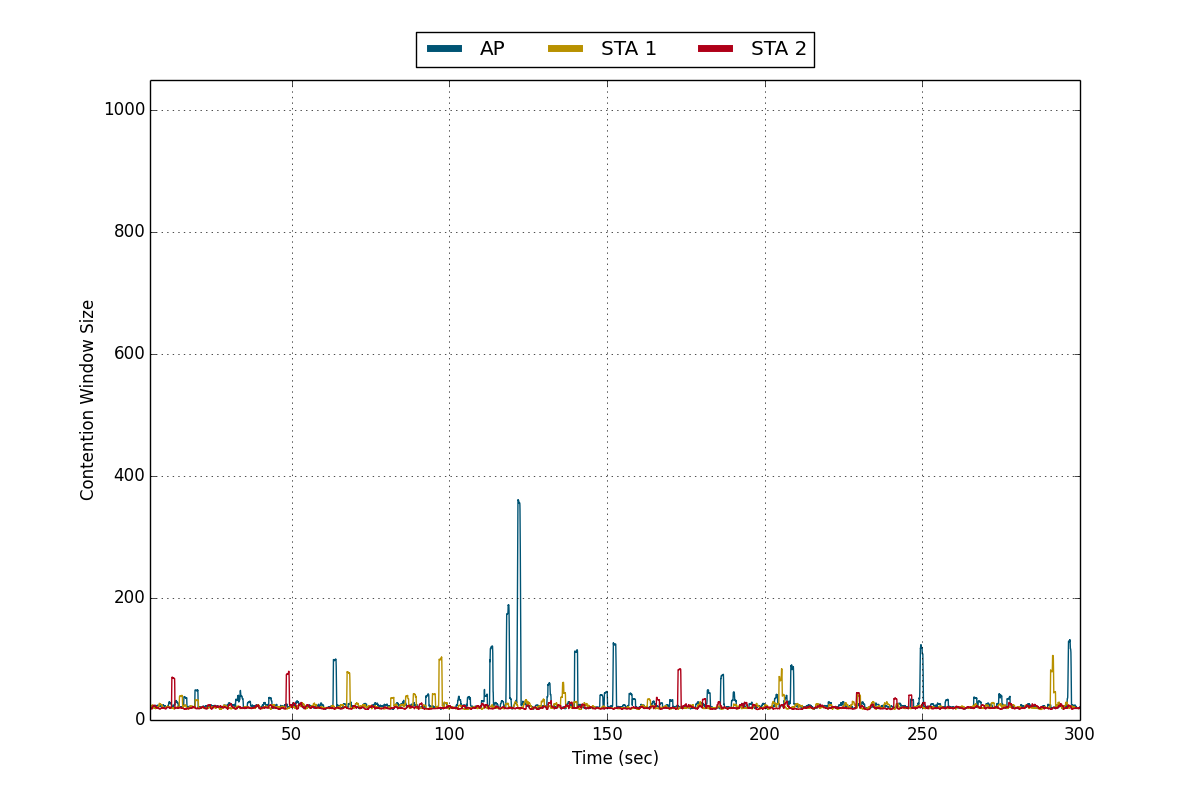
- Contention Window vs. Time: plots the contention window at each node for every PHY transmission
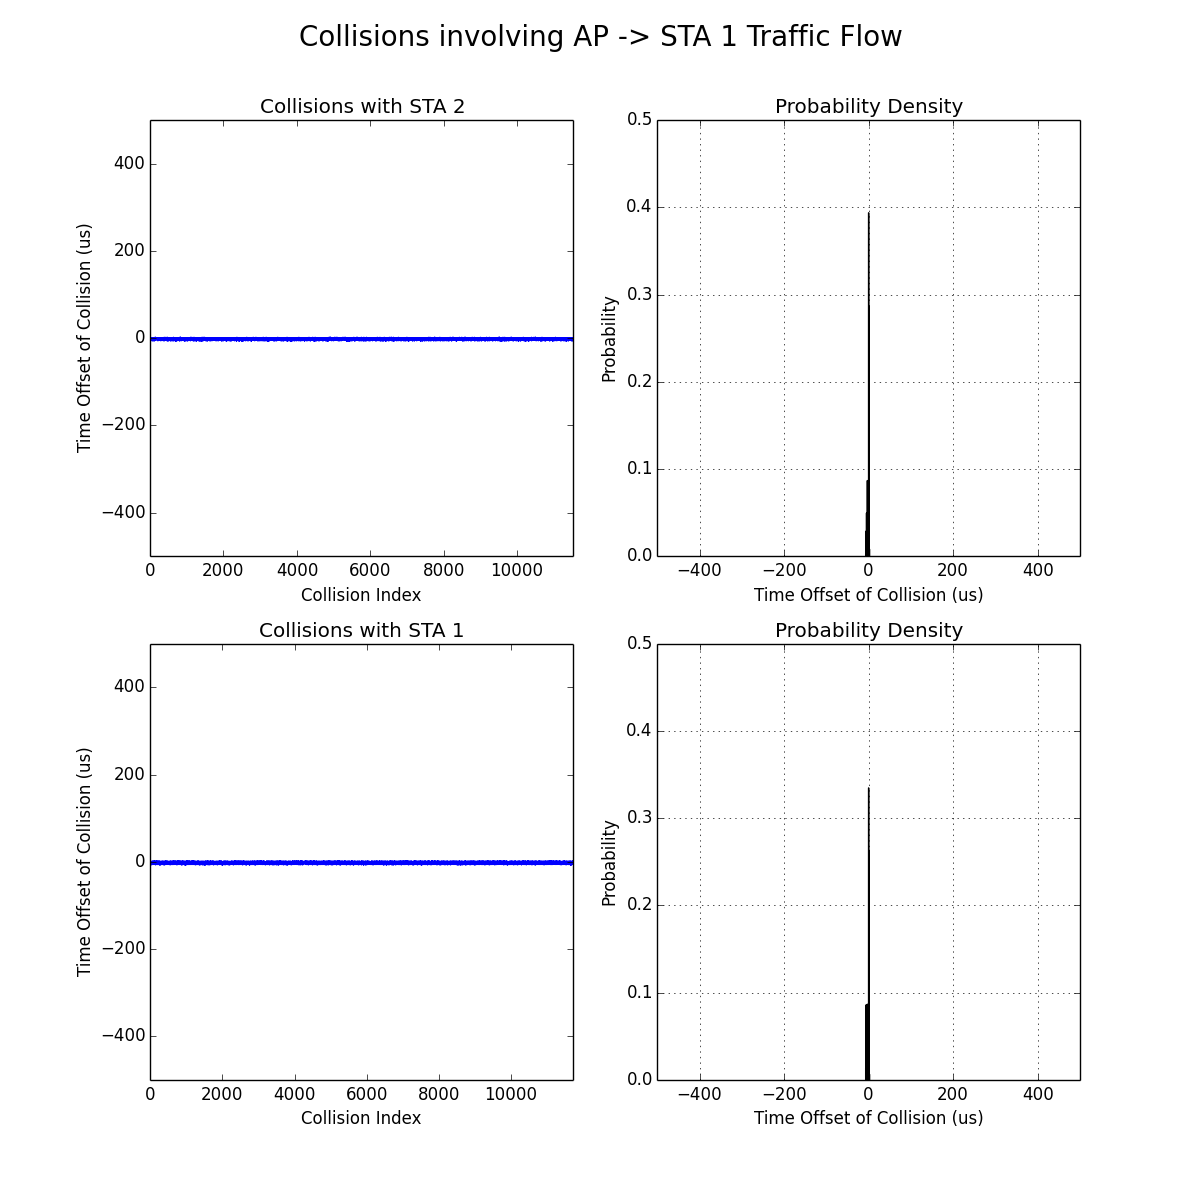
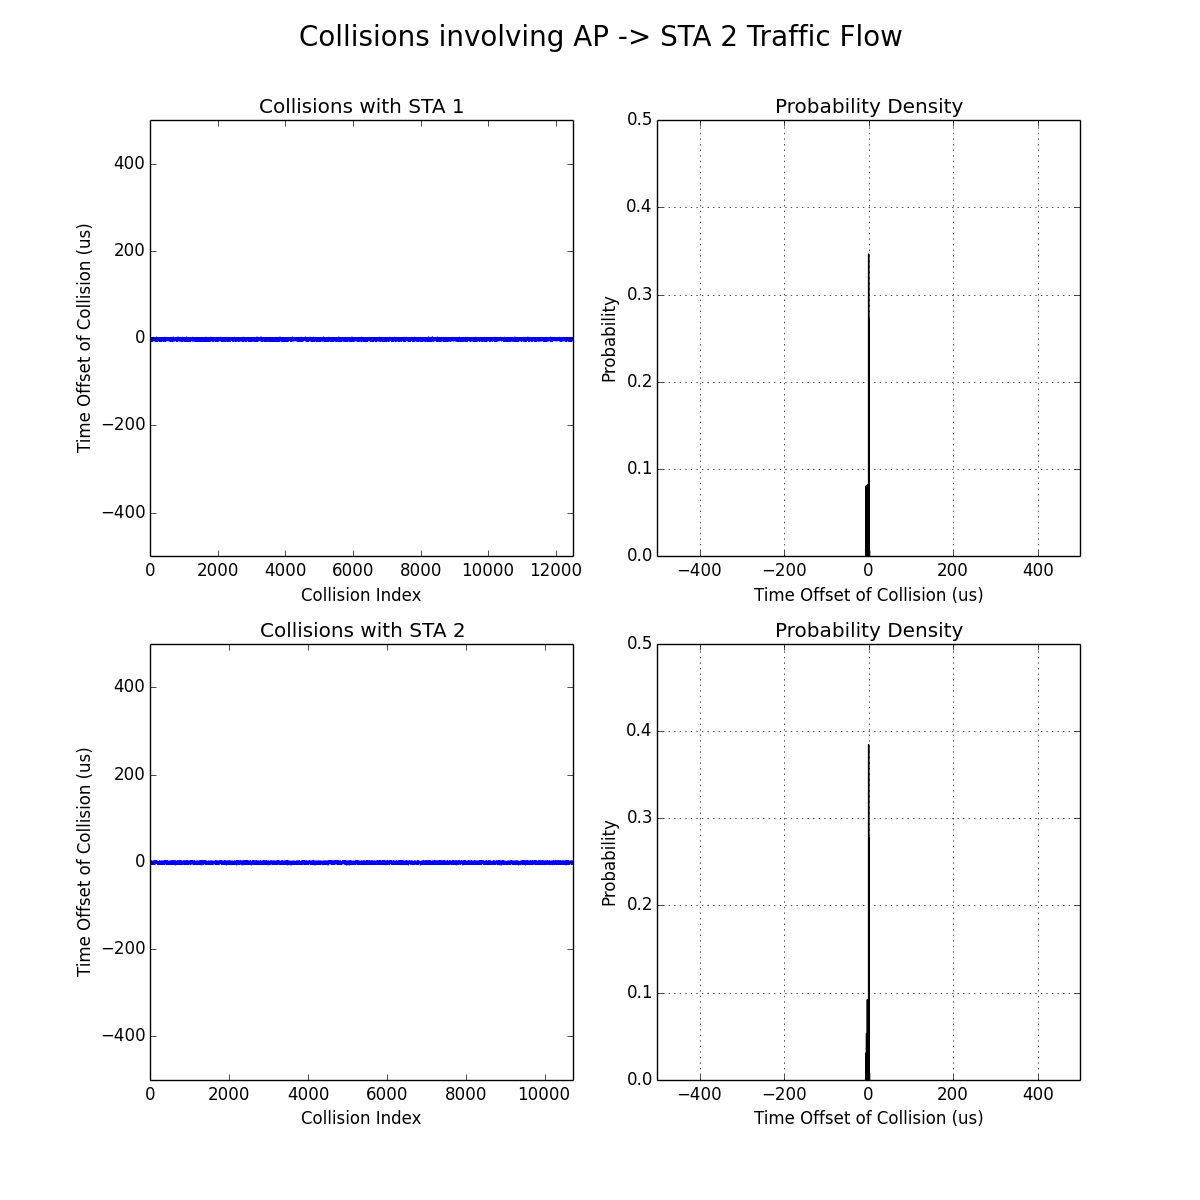
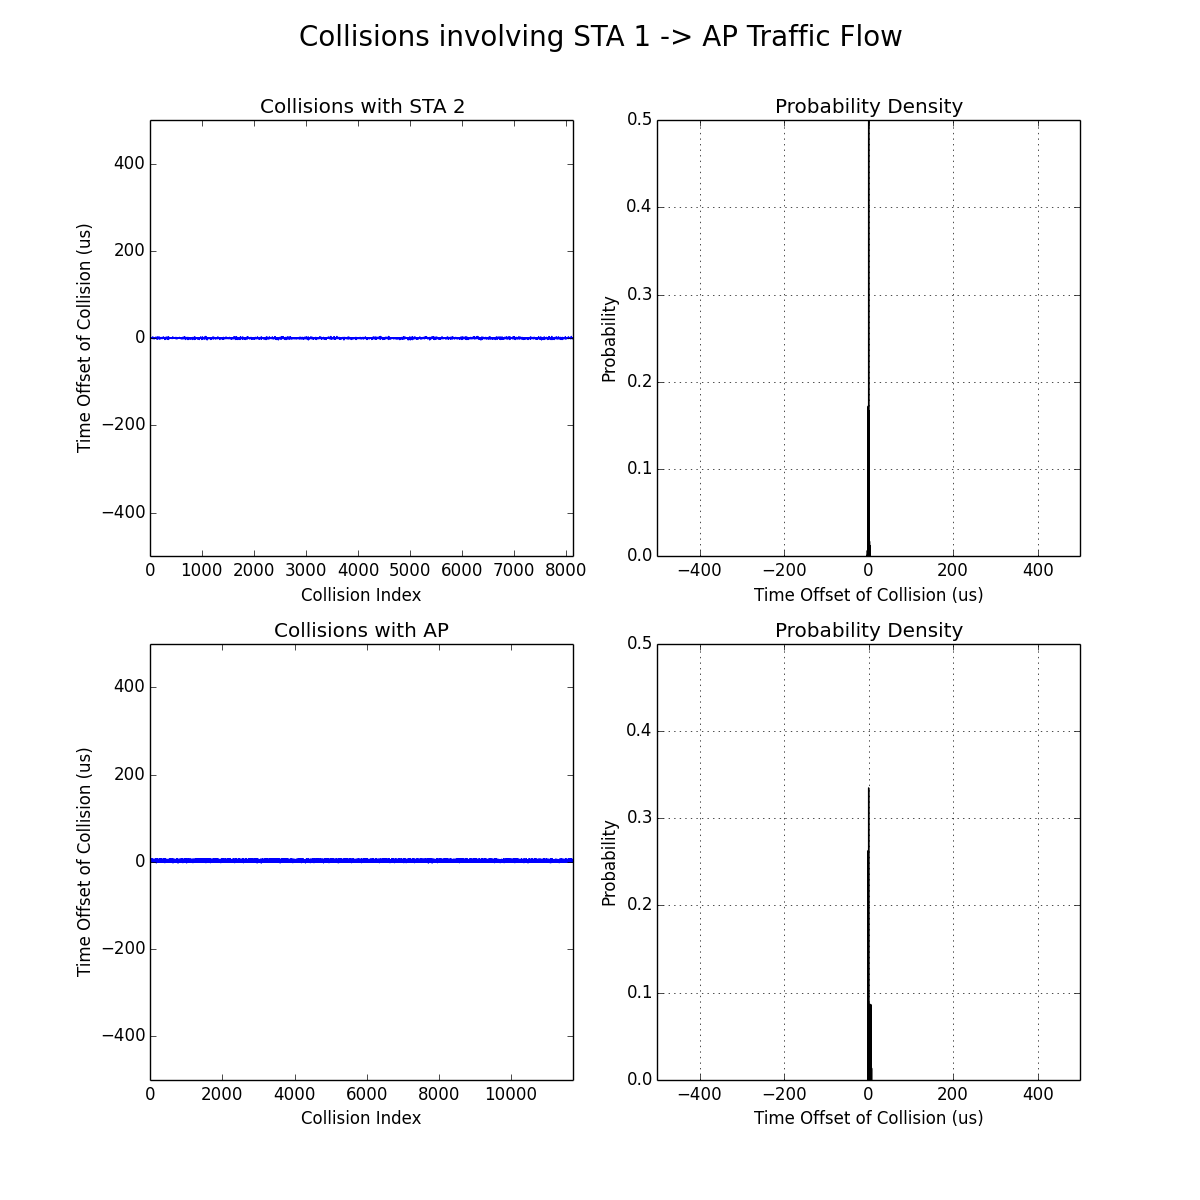
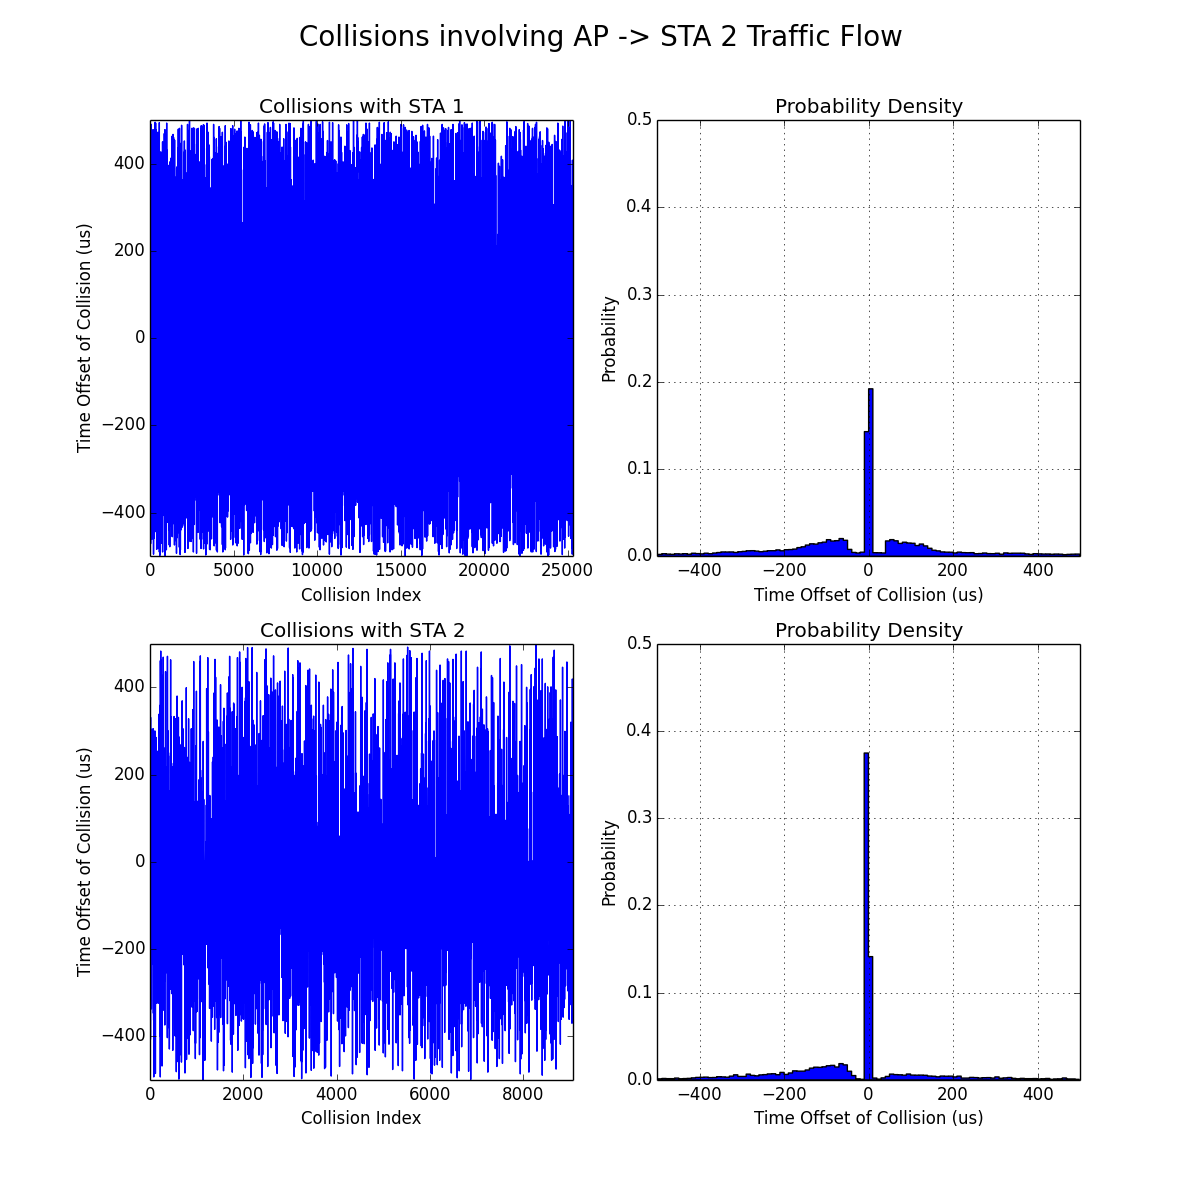
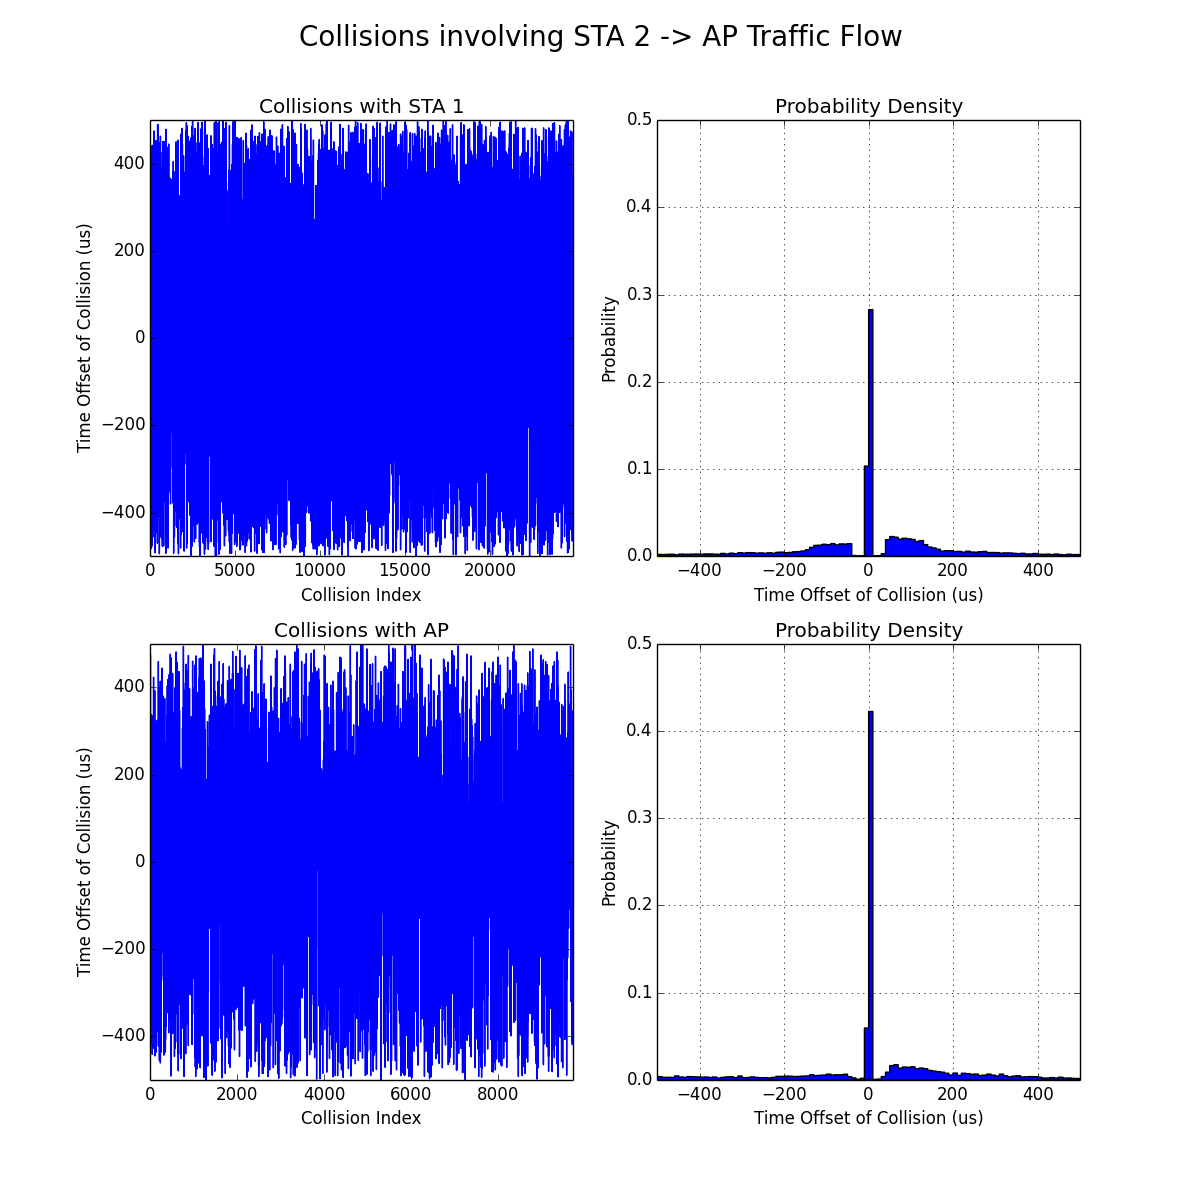
- Collision Time Offsets: plots the difference in start times of transmissions that collided, broken down by flow and colliding transmitter
Results
 | 
|
Throughput vs. Time Throughput Histogram
|
| Rx Power vs. Time |
|
| Rx Power vs. Time |
 | 
|
 | 
|
 | 
|
| Collisions (Zoomed) | Collisions (1 second) |
Experiment 2: Disabled Physical Carrier Sensing
Experiment Details
- Packet Length: 1400 byte payloads (1428 bytes OTA with MAC header and FCS)
- PHY Rate: 18 Mbps
- Tx Power: -5 dBm
- Trial Duration: 300 seconds
- Channel 1
- Physical Carrier Sensing Threshold: 1023/1023
Results
 | 
|
Throughput vs. Time Throughput Histogram
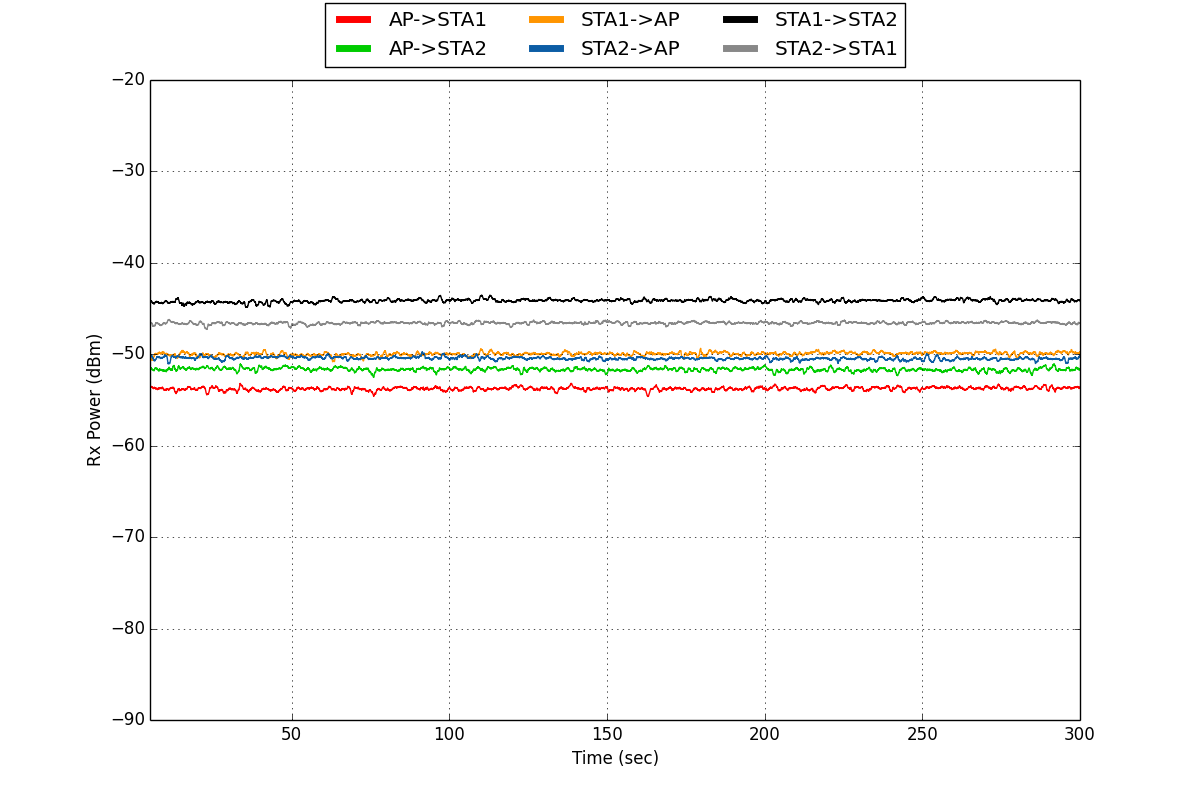
|
| Rx Power vs. Time |

|
| Rx Power vs. Time |
 | 
|
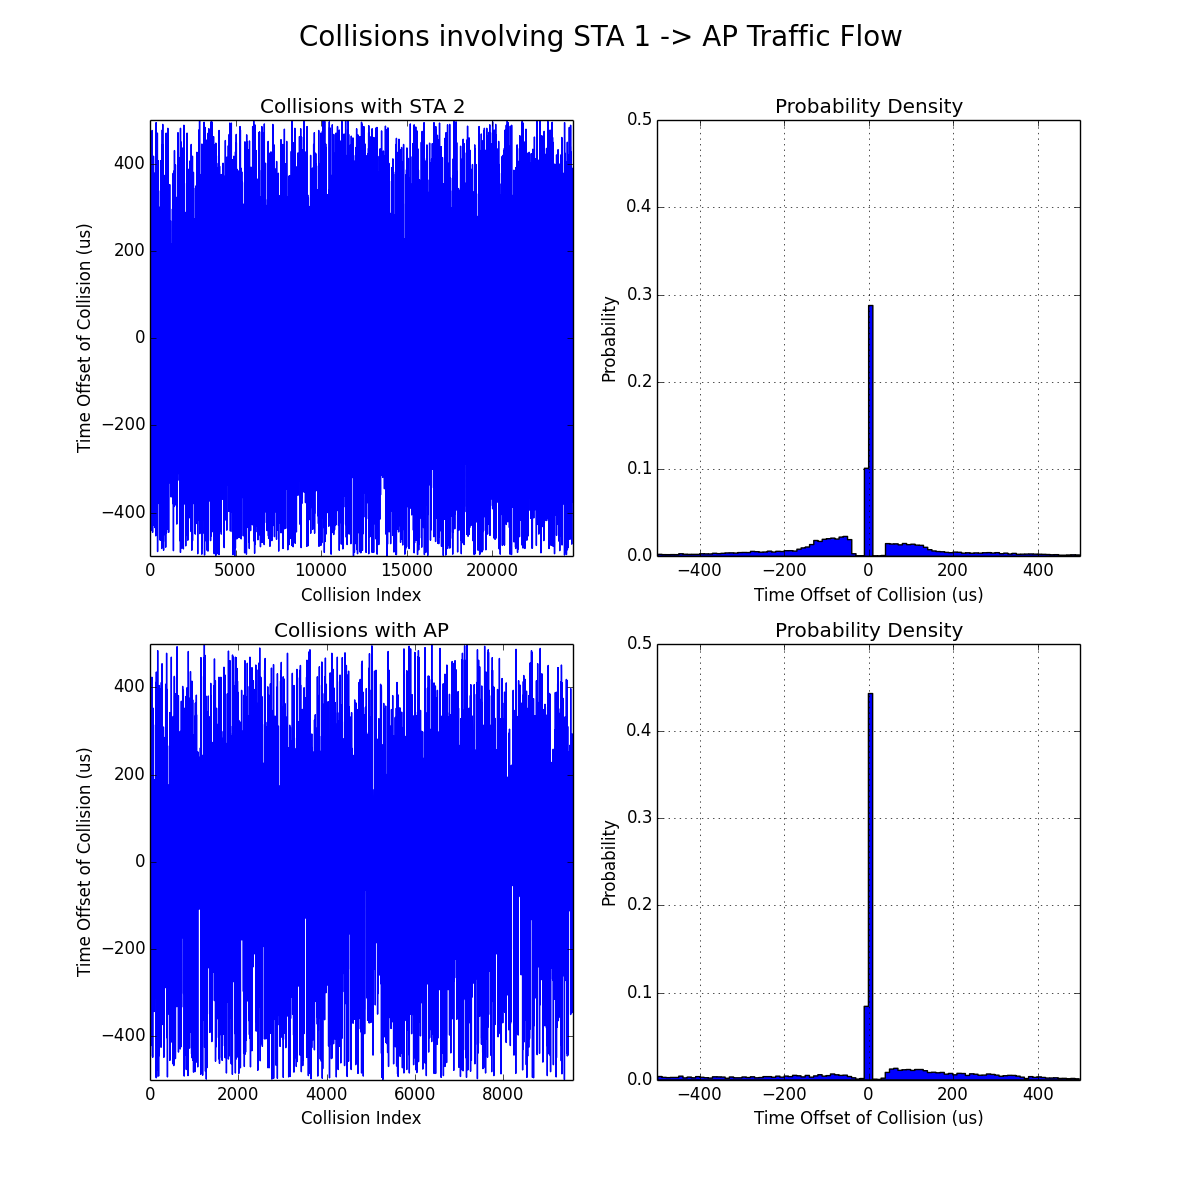 | 
|
 | 
|
| Collisions (Zoomed) | Collisions (1 second) |
Resources
Links to the data sets and experiment scripts used to perform this study will be posted shortly.
Attachments (1)
- multi-flow_python_scripts_v1_00.zip (12.9 KB) - added by chunter 9 years ago.
Download all attachments as: .zip
